

The Open Source AI Map is an evidence-based view of the open AI ecosystem: what exists, how open it is, how widely it is used, how capable it is, and where important gaps remain.
We combine broad discovery across the AI software supply chain with deeper research on prominent products. Each researched product is evaluated on three axes:
- Openness: How open is it?
- Adoption: How widely is it used?
- Capability: How well does it perform?
Every score is backed by cited evidence. Products we have discovered but not yet researched remain part of the long tail: we may track usage signals, but we do not assign full scores until the evidence has been reviewed.
The full methodology, data, and analysis are available in the Open Source AI Map repository.
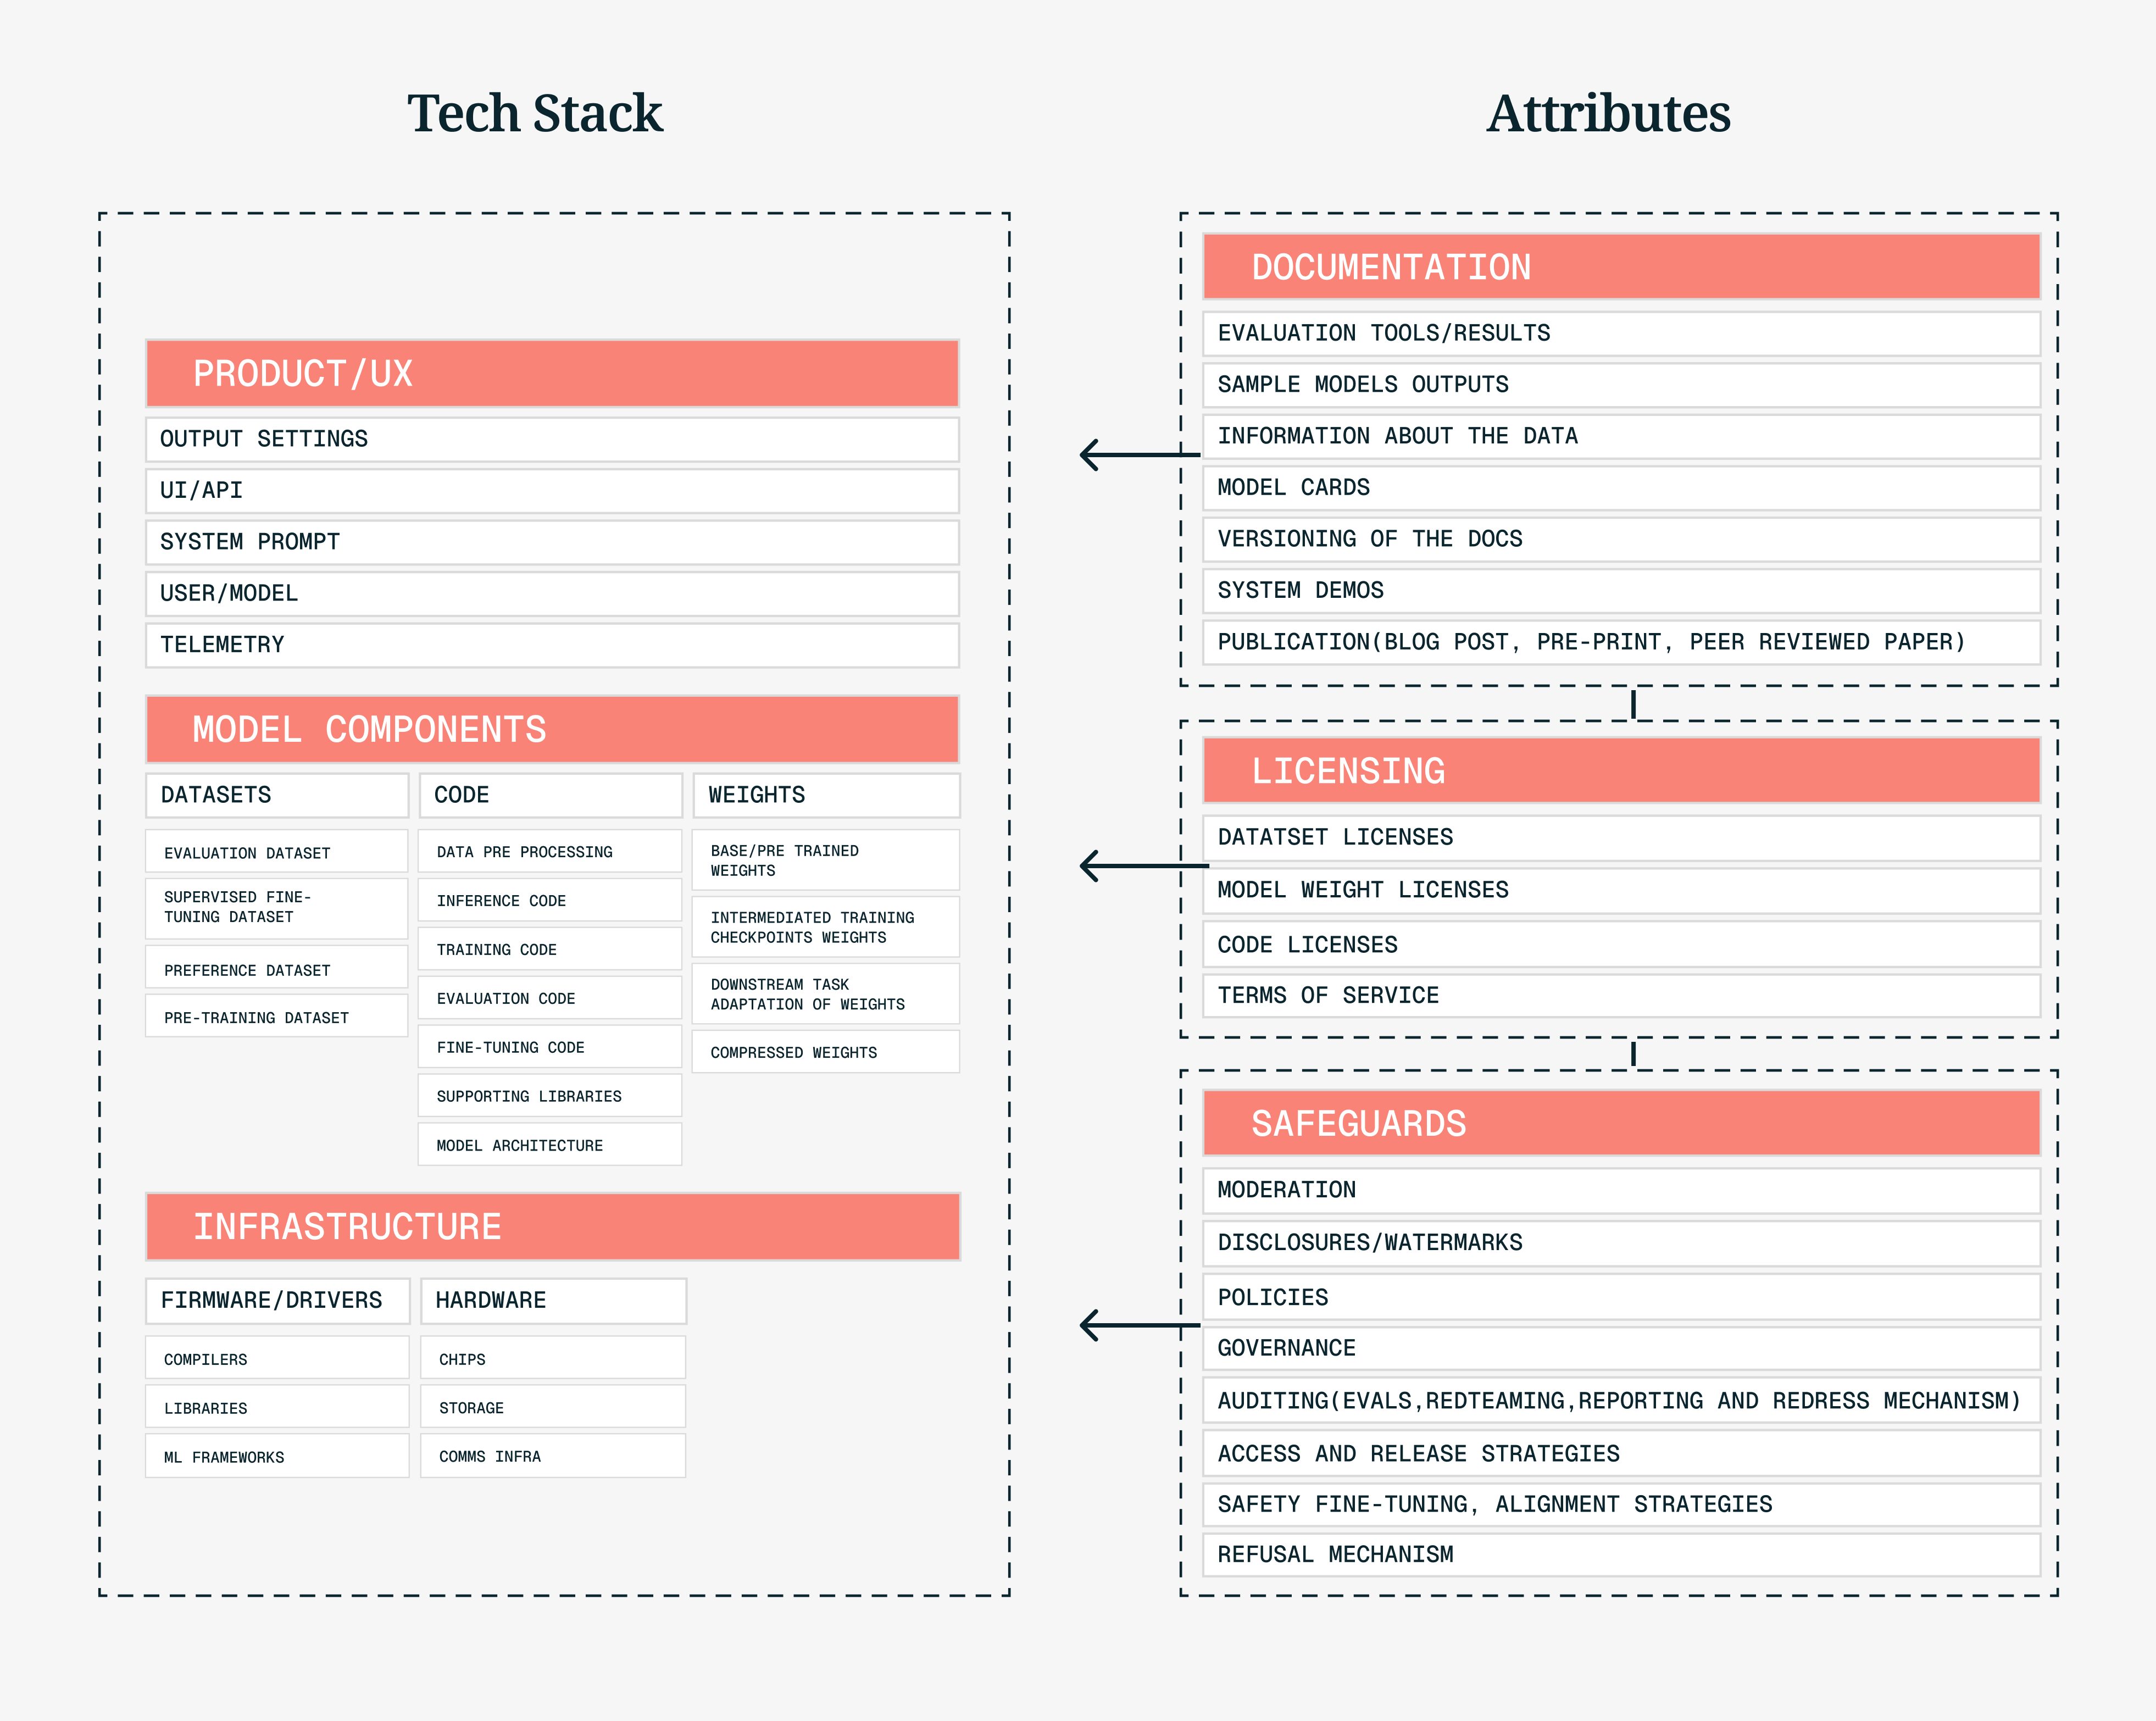
Our taxonomy and approach to openness build on the 2024 Columbia Convening on Openness in AI, the Model Openness Framework, and established open source licensing standards.
The Gap Map scores both products and categories
The map scores products and categories separately, using different criteria for each.
Products are evaluated on openness, adoption, and capability. Adoption and capability are combined into an overall score representing how strong a product is within its category. Openness is assessed separately.
Categories are evaluated based on the strength of their fully open products. Each category receives a Maturity Stage from 0 (Void) to 5 (Mature), along with one or more gaps describing what its open ecosystem still lacks.
A product can therefore be highly capable and widely used without being fully open, while a category is considered mature only when strong fully open alternatives exist.
How we discover and score products
We use two complementary processes for adding new products to the map: discovery and scoring.
Discovery identifies candidate products across the AI stack. We draw on large-scale software supply-chain data from Open Source Observer, along with GitHub, Hugging Face, package registries, benchmark leaderboards, research publications, and other public sources.
Discovery is intentionally broad, helping us find the long tail of models, datasets, software, and hardware relevant to the open AI ecosystem.
Scoring is more selective. We research prominent products in depth, classify them into the map's categories, and evaluate them against the three axes. We prioritize products with meaningful evidence of use or importance rather than attempting to score every artifact we discover.
The result is a curated map rather than a census.
Products are measured across 3 axes
1. Openness asks how much of a product is genuinely available for others to inspect, use, modify, and build upon.
We do not treat openness as a simple yes/no property. A product may expose source code but not training data, release model weights under restrictions, or make its full development pipeline openly available.
We assess both an openness class and a more detailed openness score. For comparisons across the stack, products fall into three broad groups:
- Open: Meets the relevant external standard for openness.
- Open-ish: Important components are available, but meaningful restrictions or missing pieces remain.
- Closed: The product or essential components are not openly available.
What counts as openness depends on the product type. For software, licensing is central. For models, we consider elements such as weights, code, data, checkpoints, and licenses. Datasets and hardware have analogous criteria.
Detailed openness scores are relative to what is achievable for that product type, so they should not be treated as universal cross-category rankings.
This is also why we distinguish open source from open weights. Releasing weights is valuable, but it does not by itself make the full system open.
2. Adoption asks whether a product is actually being used.
We prefer direct usage signals — such as package downloads, model downloads, active users, or deployments — over measures of attention or popularity. The right evidence varies by product type and may come from package registries, model hubs, usage trackers, developer activity, or other public sources.
Repository stars can provide a useful signal when better data is unavailable, but they are not treated as equivalent to real usage.
Adoption measures are imperfect and can change as platforms change how they report activity. We therefore treat them as evidence rather than absolute truth and record the source and date behind each assessment.
3. Capability asks how well a product performs at the job it is designed to do.
Where strong community benchmarks exist, we use them. Where benchmarks are unavailable or inappropriate, we use structured comparisons of features and functionality. For some product types, a meaningful capability score may not be available.
Capability is inherently category-specific. A model, dataset, vector database, inference engine, and user interface cannot meaningfully be ranked on one universal scale.
Capability scores should therefore be compared within categories, not across the entire AI stack.
Categories are ranked by 'maturity stage'
Maturity is a property of a category, not an individual product.
The maturity ladder asks: How healthy is the fully open ecosystem in this part of the AI stack?
Only fully open products advance a category's Maturity Stage. Open-weight, source-available, or otherwise partially open products remain visible and may be highly capable or widely adopted, but they do not count as substitutes for fully open alternatives.
The stages are:
- Stage 5 — Mature Open Ecosystem: Several fully open products lead the category, providing meaningful redundancy and resilience.
- Stage 4 — Competitive Open Ecosystem: A small number of fully open products lead the category.
- Stage 3 — Viable Alternatives: Fully open options are proven in real use, but none leads the category.
- Stage 2 — Emerging Alternatives: Fully open products are becoming credible but remain limited in adoption or capability.
- Stage 1 — Open Experiments: Fully open products are absent or remain substantially limited.
- Stage 0 — Void: The category is still nascent overall, with no category-leading products and no meaningful fully open options.
The stages are intended as a consistent diagnostic, not a claim that every part of the stack must reach Stage 5.
Gaps tell us what a category is missing
Maturity tells us where a category stands. Gaps explain what is missing.
A category may carry one or more gaps:
- Existence: Needs a usable fully open option.
- Capability: Needs a more capable fully open option.
- Adoption: Needs broader adoption of its fully open options.
- Resiliency: Needs more fully open products at the leading tier.
- Openness: Needs its category-leading products to be fully open.
- Disclosure: Needs closed alternatives to disclose more about their data, training process, or other essential inputs.
These gaps are intentionally separate. A category can have excellent products but still face an openness gap, or have a strong open product but face a resiliency gap because too much depends on a small number of projects.
The vocabulary can expand as better evidence becomes available for issues such as maintenance health, concentration, or bus-factor risk.
Each category also carries an 'openness verdict'
Each category also receives a simple verdict describing which openness tier leads among its strongest products: open, open-ish, closed, or competitive when no tier clearly dominates.
This is a summary rather than a replacement for the underlying data. The map still shows the mix of open, partially open, and closed products within each category.
This methodology is auditable by design
The methodology is deliberately multi-source. Different questions require different evidence: licenses and primary documentation for openness, usage data for adoption, and benchmarks or structured comparisons for capability.
For every researched value, we record the supporting source and when it was checked. When we cannot establish a claim with adequate evidence, we prefer to leave it unscored rather than guess.
The result is auditable: readers can inspect the evidence behind a score and challenge the judgment. The scores themselves still involve editorial judgment and should not be mistaken for the output of a purely mechanical formula.
This methodology has limitations and is evolving
The map is a curated view of a fast-moving ecosystem, not a complete census.
Important limitations include:
- The deeply researched set emphasizes prominent products, while a much larger long tail remains only partially characterized.
- Evidence quality and availability vary across product types.
- Adoption measures are imperfect proxies and can change with reporting methods.
- Capability scores are category-specific and should not be compared directly across unrelated categories.
- Detailed openness scores are also product-type-specific; broader openness classes are better for comparisons across the stack.
- Some classifications require editorial judgment where external standards do not provide a definitive answer.
- Public documentation cannot reveal every real-world dependency, deployment pattern, or relationship between products.
The map should therefore be read as a transparent, evidence-backed assessment of the open AI ecosystem — one designed to improve as the evidence, methodology, and ecosystem evolve.
Contribute to the Gap Map
If you see missing products, better evidence, incorrect classifications, or ways to improve the methodology, we welcome contributions through the Open Source AI Map repository.
Contribute